Teams Overview
The Teams section is your central hub for scouting intelligence. It provides a comprehensive view of every team at the event, combining technical pit data with real-time performance analytics captured by your scouts.
The Teams List
Section titled “The Teams List”The main Teams List gives you a high-level view of all participating teams. You can quickly see team numbers, names, and logos.
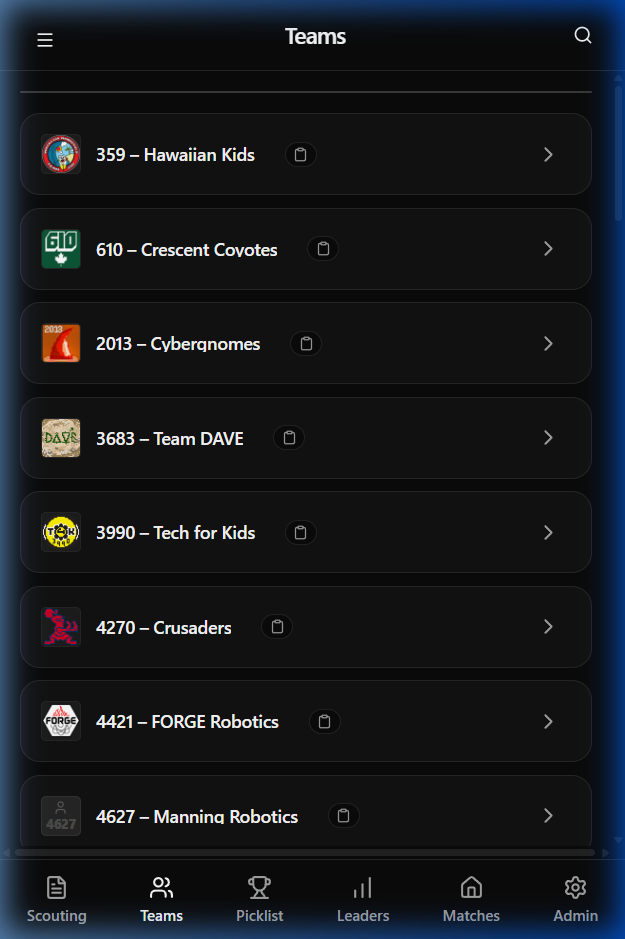
:::tip Use the search icon in the top-right corner to quickly find a specific team by number or name. :::
Detailed Team Analysis
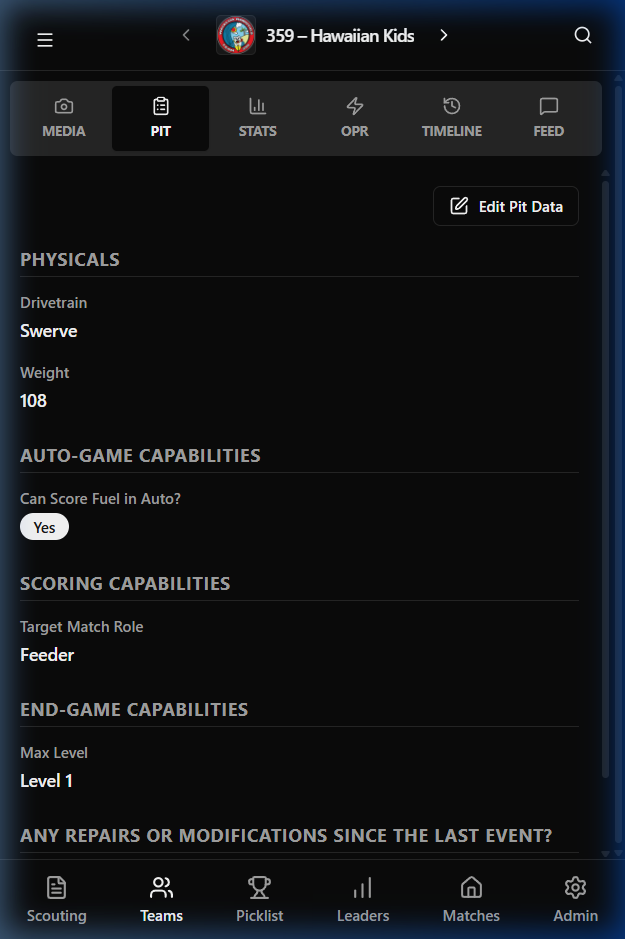
Section titled “Detailed Team Analysis”Clicking on any team opens their Team Detail view. This view is divided into several tabs to help you dive deep into their performance.
Pit Data
Section titled “Pit Data”The Pit tab contains technical specifications collected by pit scouts. This includes physical attributes like drivetrain type and weight, as well as scoring and endgame capabilities.
Performance Stats
Section titled “Performance Stats”The Stats tab is the heart of your strategic analysis. It displays aggregated averages from all scouted matches.
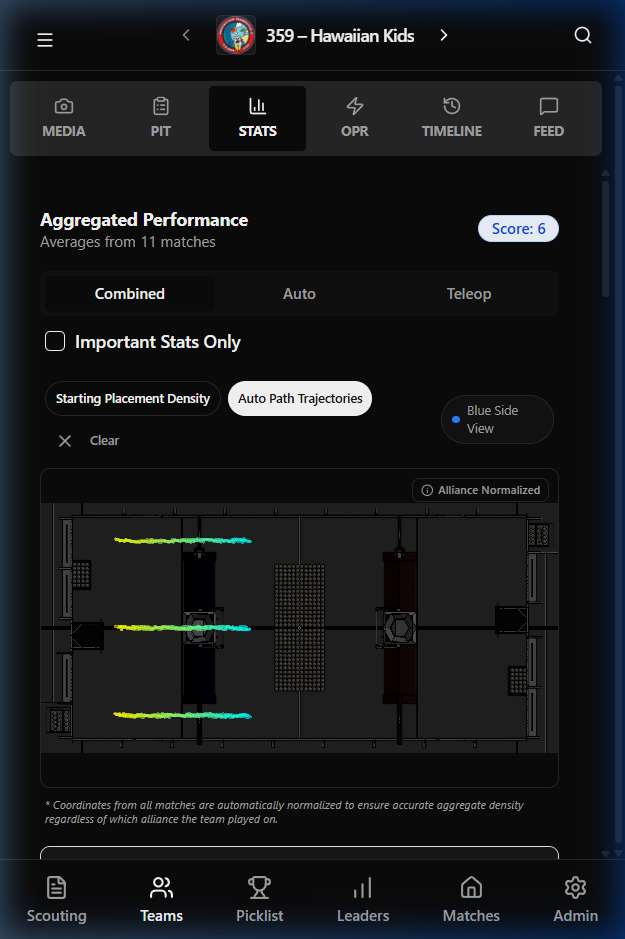
Key features include:
- Aggregated Performance: Dynamic averages for Auto, Teleop, and Combined scores.
- Auto Path Trajectories: A heatmap visualizing the robot’s typical paths during the auto phase.
- Density Maps: Heatmaps showing starting placements and scoring localized density.
Team Feed
Section titled “Team Feed”The Feed tab allows you to see the “social” side of scouting. Every comment or observation made by a scout during a match or in the pits is logged here chronologically.
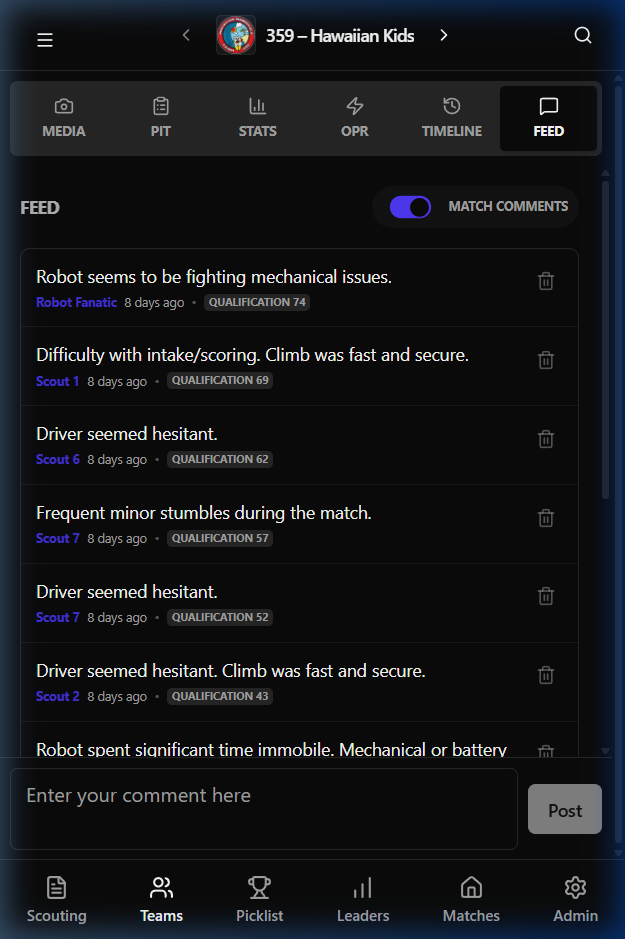
:::caution[IMPORTANT] Pay close attention to the Feed for mentions of mechanical issues or driver inconsistency which might not show up in the raw stats! :::
Technical Metrics (OPR & Timeline)
Section titled “Technical Metrics (OPR & Timeline)”For advanced strategy, the OPR tab pulls data from The Blue Alliance to provide standard metrics like OPR, DPR, and CCWM. The Timeline tab gives a match-by-match breakdown of every game the team has played in the current event.