Leaderboards & Analytics
The Leaders tab is a powerful data visualization engine that allows you to compare every team at the event across dozens of scouted and calculated metrics.
Performance Overview
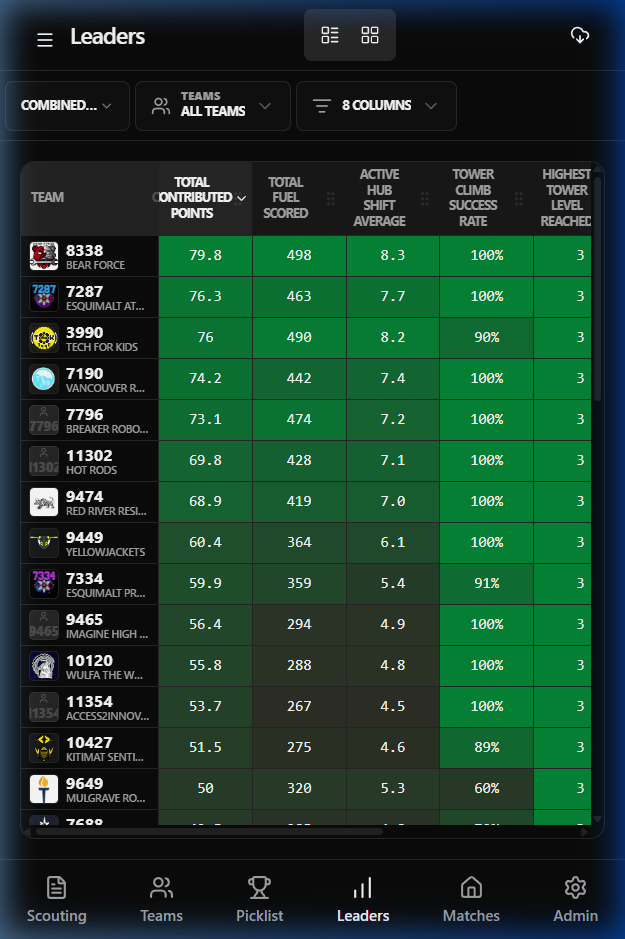
Section titled “Performance Overview”By default, the Leaders tab displays teams ordered by team number. The table comes pre-configured with a set of default columns (including Contributed Points, Fuel Scoring, and Climb Success) to provide an immediate overview of the field.
Category Filtering
Section titled “Category Filtering”Use the category dropdown to filter stats by:
- Combined Stats: Overall performance across all matches.
- Auto Stats: Performance strictly during the autonomous period.
- Teleop Stats: Performance strictly during the teleop and endgame periods.
Metric Management (Columns)
Section titled “Metric Management (Columns)”The app allows you to customize exactly which metrics you see in your table. This is essential for focusing on specific strategic goals (e.g., finding the best “Feeder” robots).
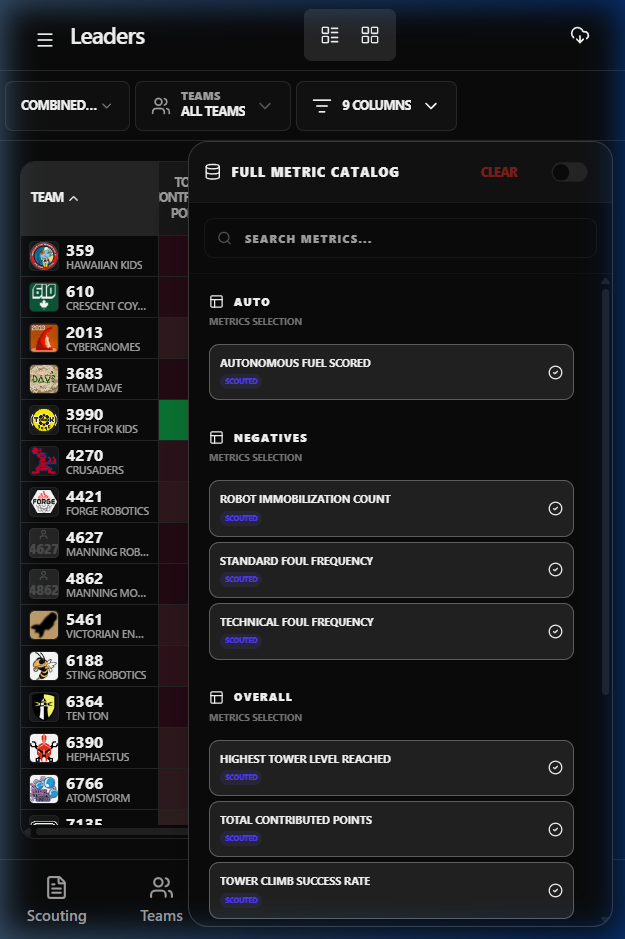
- Click the Columns dropdown (e.g., “9 Columns”).
- Browse the Full Metric Catalog, including Auto, Scoring, Negatives, and Overall categories.
- Toggle any metric to instantly add or remove it from the table.
:::tip You can also view advanced calculated metrics like OPR and CCWM pulled directly from the TBA API! :::
Customizing Your View
Section titled “Customizing Your View”Sorting
Section titled “Sorting”Click any column header to sort the entire leaderboard by that metric. A small arrow will indicate whether you are sorting in ascending or descending order.
Drag-and-Drop Reordering
Section titled “Drag-and-Drop Reordering”You can rearrange columns to place related stats side-by-side.
- Click and hold the grab handle (six dots) in a column header.
- Drag the column to its new position and release.
Advanced Analysis (Grid View)
Section titled “Advanced Analysis (Grid View)”For a more visual “robot profile” assessment, toggle to the Grid View using the four-square icon in the header.
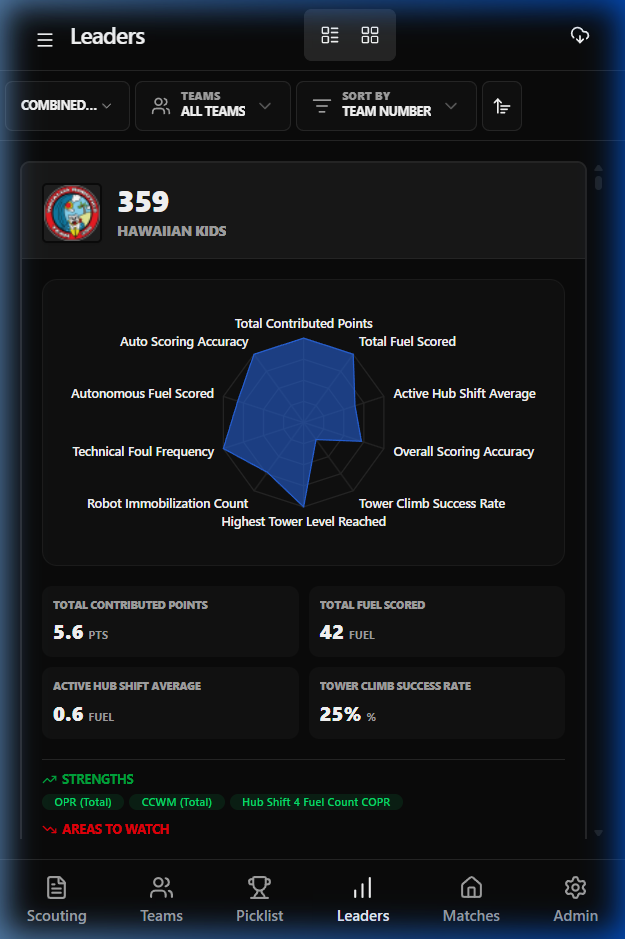
In this view, each team is represented by a card featuring a Radar Chart. This chart provides a signature “shape” for each robot, making it easy to see if a team is a well-rounded generalist or a high-scoring specialist.
:::caution[PRO-TIP] Look for large, balanced radar charts to identify potential first-pick alliance captains! :::